Features
Cutting Edge Solutions
Transit Code's cloud-based software and mobile application replace manual surveying, paper forms, complicated spreadsheets, data compilation and put’s real time results in the palm of your hands. Our products and support will ensure that your field surveys are accurate and complete, allowing you to complete projects with the highest levels of customer satisfaction.
Bus Stops
Collect ADA compliance related data, mitigating risk before it’s too late. Transit Code allows clients to maintain real-time inventory, view photos, set replacement intervals, and manage maintenance schedules. Use intuitive smart forms to complete ADA assessments which populate an interactive map that can be accessed 24/7 to view live results in your customer portal.schedules. In addition to conducting bus stop inventories, our field surveyors also collect ADA compliance related information, allowing our customers to mitigate risk before it’s too late. Our field surveyors work online from tablets which populate an interactive map that can be accessed 24/7 to view live results via our client portal. Our team is highly experienced at collecting data points!
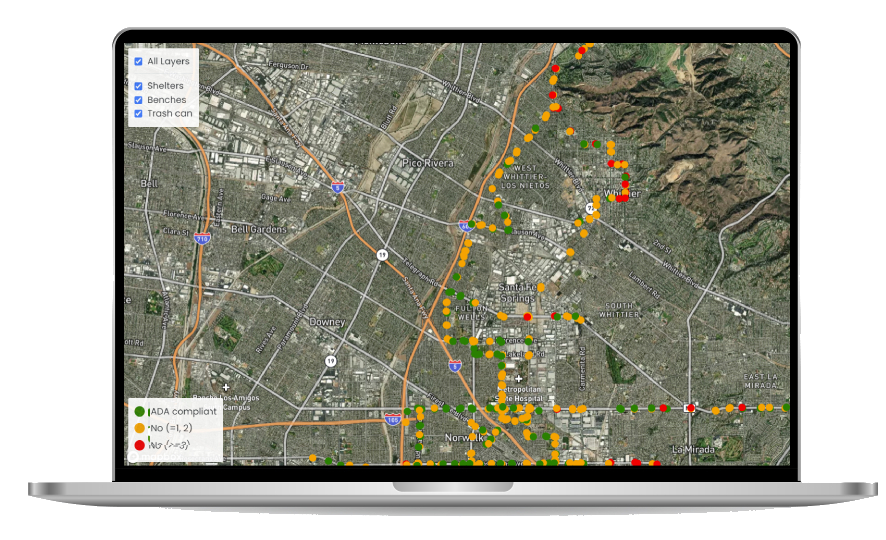
View bus stop markers which are color coded by ADA compliance
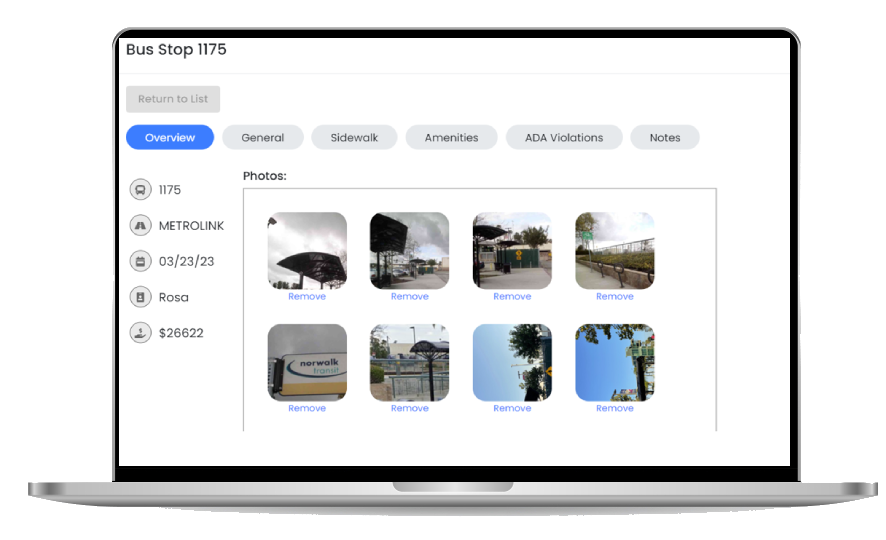
Click on market to see bus stop photos, inventory, ADA violations and notes
Download results to microsoft excel and import into ArcGIS, BLuedag and more
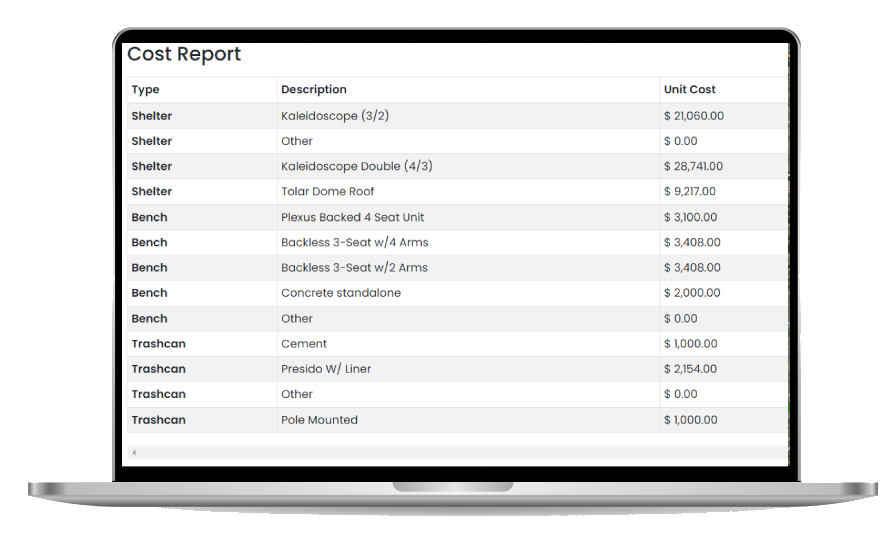
View ammenity cost reports and more
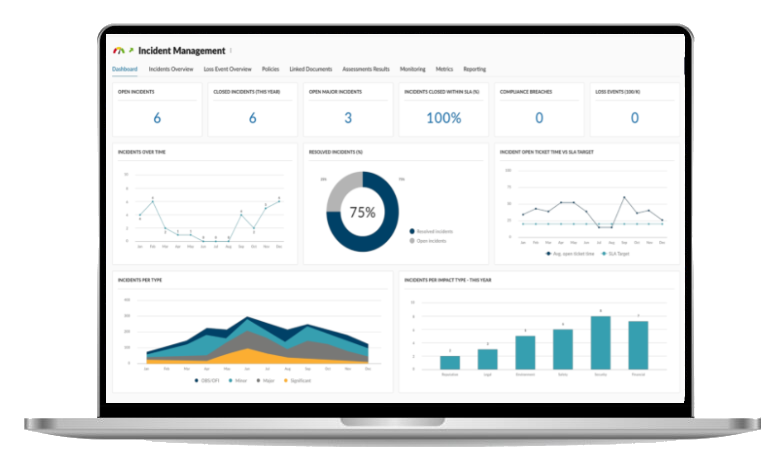
Allow users to report issues or incidents related to bus stops and include photos and detailed descriptions of problems.
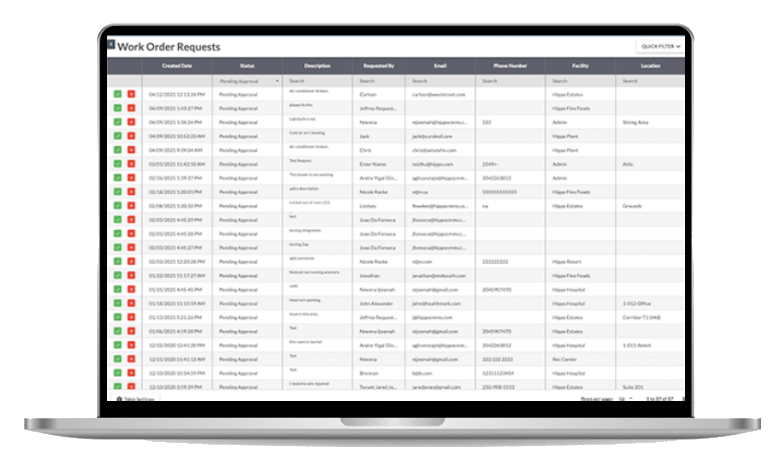
Create and manage work orders for repairs or upgrades. Track the status of work orders from initiation to completion.
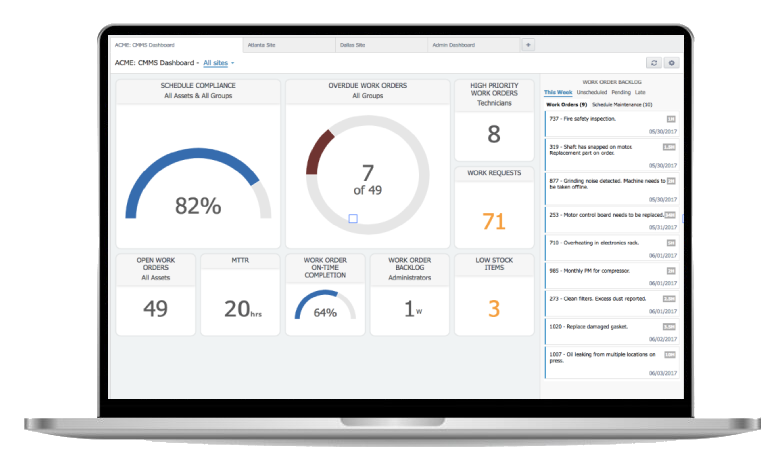
Schedule and track routine maintenance tasks for each bus stop. Set up automated reminders for maintenance activities.
Maintenance Solutions
Allow users to report issues or incidents related to bus stops and include photos and detailed descriptions of problems.
Create and manage work orders for repairs or upgrades. Track the status of work orders from initiation to completion.
Schedule and track routine maintenance tasks for each bus stop. Set up automated reminders for maintenance activities.
Sidewalk and Pathways

View color-coded markers (based on cross slope % readings) with accurate GPS readings
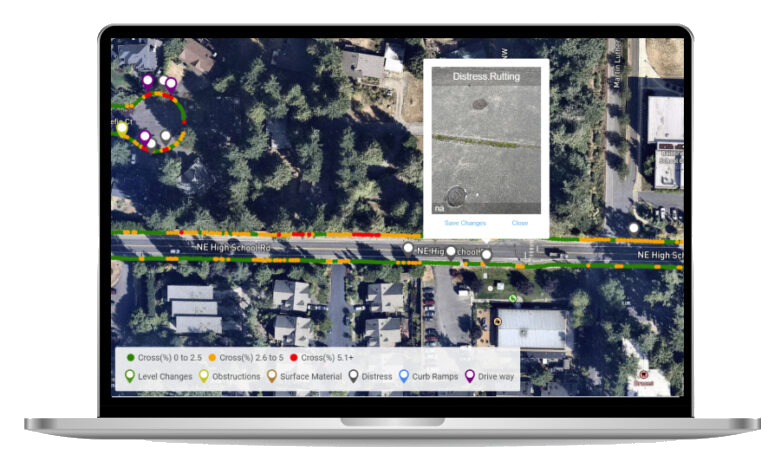
Click on obstruction markers to see photo, description, notes and reccomendations
Download results to microsoft excel and import into ArcGIS, BLuedag and more
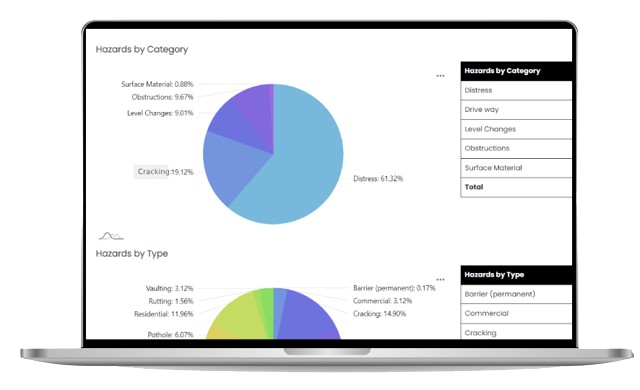
Data & Reports

Compatible with ArcGIS, QGIS, BLuedag and more
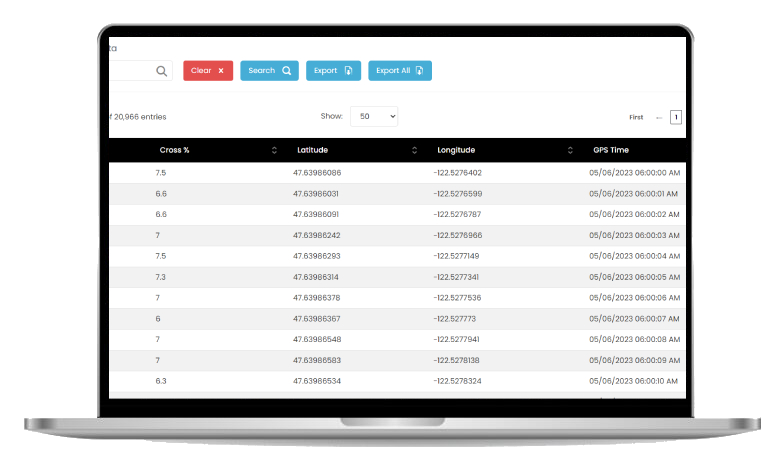
Data & Reports
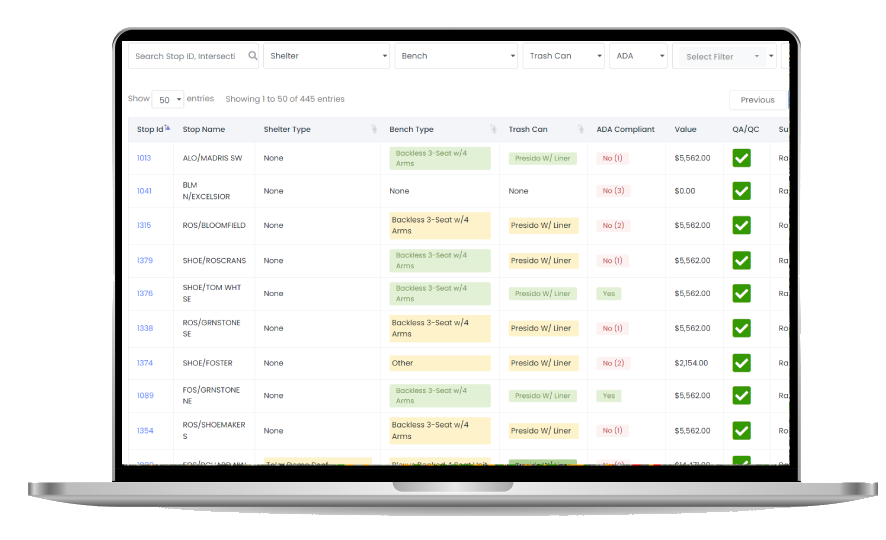
The report features of Transit Code offer a user-friendly and comprehensive data presentation experience. The platform includes easy-to-read graphs, tables, and charts, facilitating efficient data interpretation. Additionally, users have access to raw data that is searchable, filterable, and exportable to Excel, enhancing flexibility in data manipulation.
Transit Code goes beyond basic reporting capabilities by ensuring compatibility with ArcGIS, allowing the creation of shapefiles for geographical data visualization. Furthermore, seamless integration with Bluedag enables the incorporation of Transit Code data into a comprehensive self-assessment plan. This combination of visualization tools, data manipulation options, and compatibility with industry-standard software makes Transit Code a powerful tool for data analysis and reporting in various contexts.
Data & Reports
Compatible with ArcGIS, QGIS, BLuedag and more
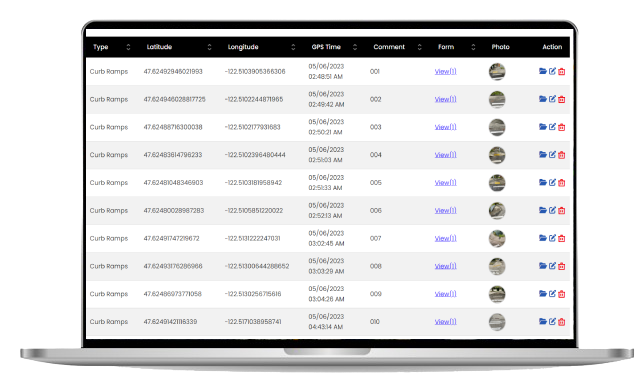
Intersections & Curb Ramps
Transit Code utilizes user-friendly and intuitive smart forms equipped with conditional logic. This innovative approach tailors the survey experience by presenting follow-up questions based on respondents’ previous answers. The software ensures a seamless and effective data collection experience.
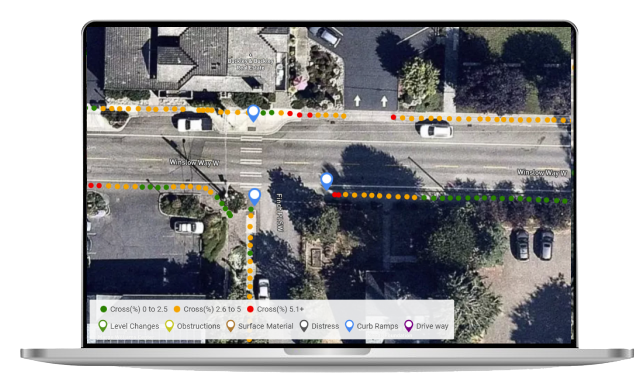
View colored markers to identify driveways, curb ramps and intersections
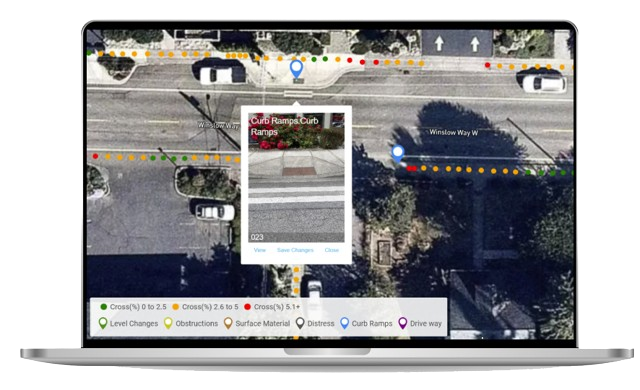
Click on markers to see photo, specs, description, notes and reccomendations